This section describes various features available in the Dashboard. Users can see the overview of application, environment, inventory, clusters, and policy violation details.
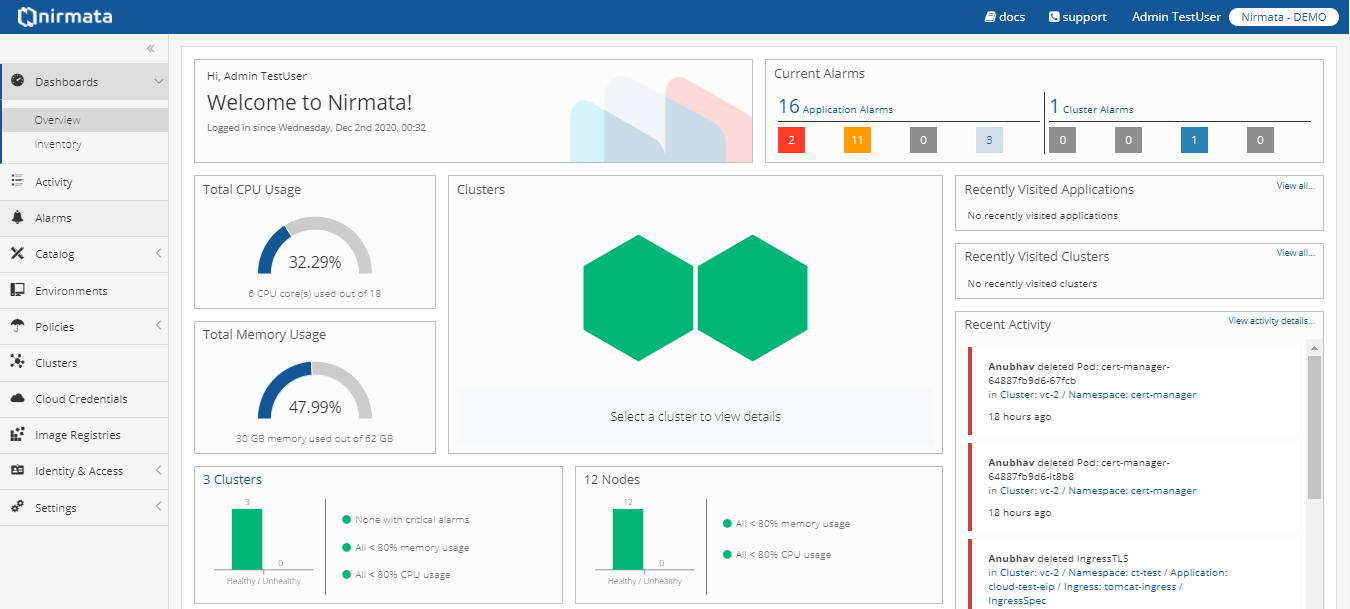
Overview
Upon first login, Nirmata users will see the dashboard that provides various details about the CPU usage, memory usage, alarms, clusters, and recent activities performed by the users.
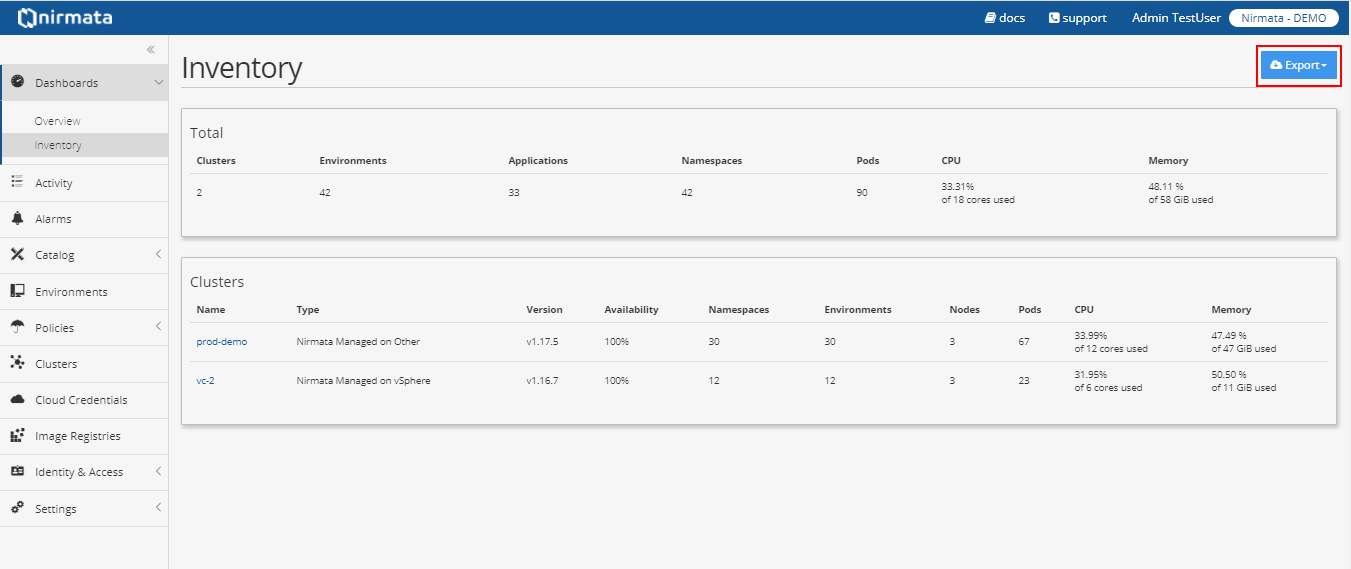
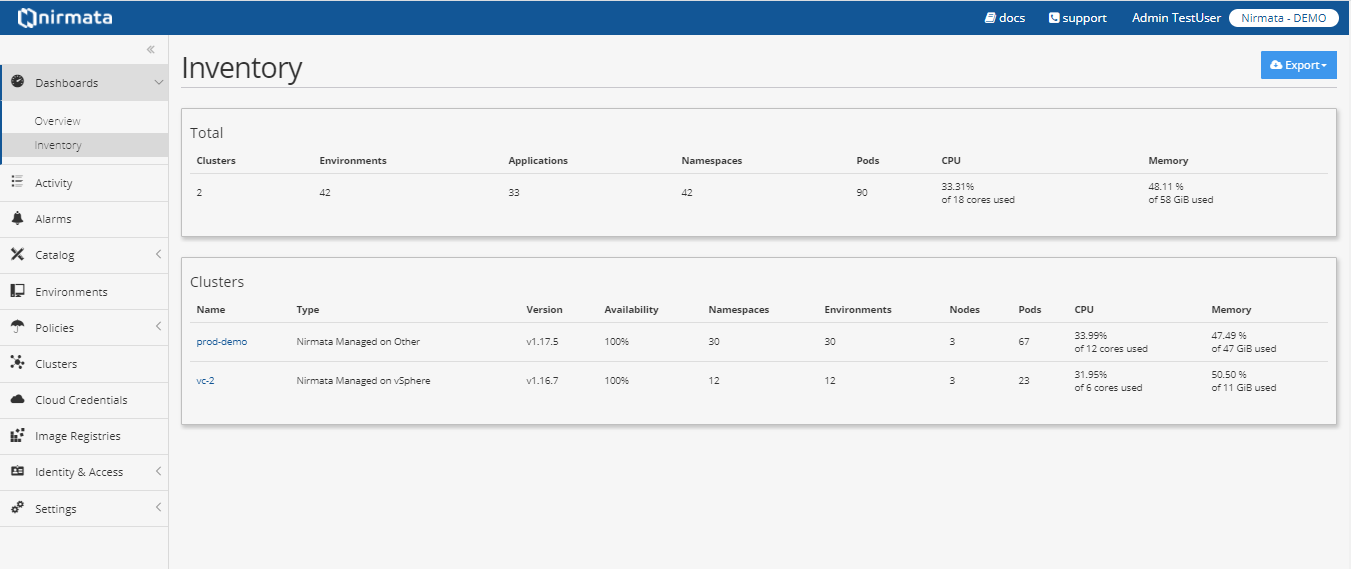
Inventory
Inventory provides the details for the clusters, environments, applications, Namespaces, Pods CPU, Memory.
Users can also click a cluster name in the Clusters section to check the details of the clusters created. Inventory details can be downloaded in the PDF or CSV format by clicking on Export button.
Compliance
All policy violations corresponding to an environment can be viewed in the Compliance section. Users can view the violated policies and the type of violations associated with the owner, cluster, and namespace of an environment.
Users can download the policies violation reports in the PDF format by clicking on the Export button.